Analysis:
Confirmatory Factor Analysis and Composite Reliability
A CFA was conducted along with a reliability analysis to assess construct validity. Examination of modification indices and factor loadings indicated that CSE1, CSE5, CSE7, PC5, ATE1, ATE6, ATE8, PP5, and PP6 were all causing significant problems with the model parameters. The results of the last iteration of the CFA performed in R showed significantly improved fit, although still poor overall (χ2(545) = 2125.61, p < .001, CFI = 0.82, TLI = 0.81, RMSEA = 0.11). The high degrees of freedom indicate that a very large number of parameters are being estimated in this model.
Composite Reliability
For the full model, each construct had excellent reliability. The ATE latent construct had a composite reliability value of 0.89. The ORC construct had a composite reliability value of 0.94. The CSE latent construct had a composite reliability value of 0.85 and PC had a composite reliability value of 0.95. For PP and RES, the composite reliability scores were 0.80 and 0.96 respectively. These values indicate that the loadings for each construct were all directionally similar, and that the items in each construct show a high degree of consistency.
Cronbach’s Alpha
Cronbach’s alpha values were calculated for the items in each construct. The alphas for PC (α = 0.90), AXY (α = 0.94), and RES (α = 0.94) indicated excellent reliability. The alphas for CSE (α = 0.80), ATE (α = 0.88), and PP (α = 0.83) all showed good reliability. These values confirm the results of the composite reliability tests, and reiterate the high degree of reliability within each latent construct.
Partial Least Squares – Structural Equation Modeling
A partial least squares- structural equation modeling (PLS-SEM) was conducted to determine how well the data fit the proposed model, and discern whether significant relationships existed between the independent and dependent constructs. The full model showed AVE values of 0.53 for ATE, 0.69 for AXY, 0.44 for CSE, .72 for PC, .35 for PP, and 0.81 for RES. The high values for AXY, PC, and RES indicate that the amount of variance accounted for in the manifest variables is sufficiently high. The values for ATE, CSE, and PP indicate that some of the variance in the manifest variables is left unexplained.
Structural Model
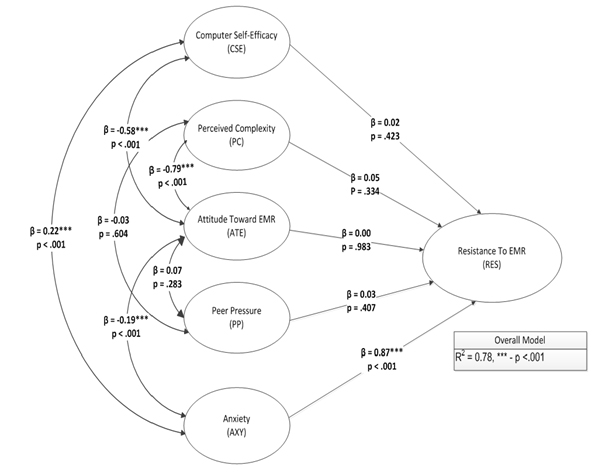
Once the measurement model had been tested for model specification, the structural model was tested to determine if ATE, AXY, CSE, PC, and PP had a significant effect on RES. A path weighted model was calculated using 10,000 bootstrap samples in R. The results showed a pseudo R-squared value of 0.78. This indicates that approximately 78% of the variance in RES is explainable by the collective effects of CSE, PC, ATE, PP, and AXY.
Further examination of the effects indicated that AXY had a highly significant effect on RES (B = 0.87, p < .001). This indicates that a standard deviation increase in AXY increases the expected value of RES by 0.87 standard deviations. CSE did not have a significant effect on RES (B = 0.02, p = .423). Additionally, CSE (B = 0.02, p = .423), PC (B = 0.05, p = .334), ATE (B = 0.00, p = .983), and PP (B = 0.03, p = .407) did not have significant effects on RES. Table 11 outlines the results of the path estimates.
Correlation Analyses
Both Pearson and Spearman correlations were calculated on the composite scores. The results of the Pearson correlations indicated that CSE was significantly correlated AXY (r = 0.22, p < .001) and RES (r = 0.21, p < .001). The results also indicated that PC was significantly correlated with ATE (r = -0.79, p < .001), AXY (r = 0.18, p < .001), and RES (r = 0.20, p < .001). ATE was significantly correlated with AXY (r = -0.19, p < .001) and RES (r = -0.19, p < .001). AXY was significantly correlated with RES (r = 0.85, p < .001).
ANCOVA Analyses
An analysis of covariance (ANCOVA) was conducted to determine if a significant relationship existed between the AXY, PP, CSE, PC, ATE scores and RES controlling for Gender, Age, Ethnicity, Education, and Specialty. The overall model was found to be significant (F(63,194) = 53.39, p < .001), with an R2 value of .95, indicating that 95% of the variance in RES was explained by the collective effect of the independent variables and covariates.
Since the overall model was found to be significant, the model’s covariates were assessed. The AXY (F(10,194) = 262.20, p < .001), ATE (F(7,194) = 2.20, p = .036), Years computers (F(1,194) = 5.71, p = .018), and PC (F(12,194) = 2.00, p = .026) scores were found to be significant, indicating that a significant amount of variance in RES is explained by AXY, ATE, and PC.
A path diagram depicting the results of the structural model.